The 10 U.S. States with the Highest User-Submitted Radon Readings (2026)
Radon is the leading cause of lung cancer among non-smokers, which is why homeowners often look for ways to understand radon risk in their area. There are several ways to think about states with the highest radon levels, including the EPA’s geological zone map, state-level public health information, and actual readings reported by people who tested their homes.

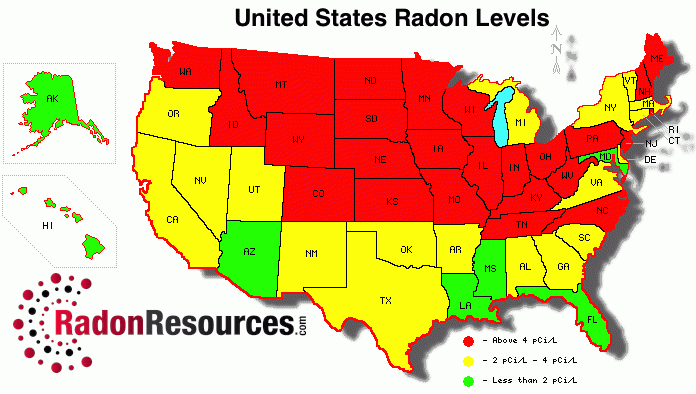
This article looks at one of those reference points: RadonResources.com user-submitted radon readings, sourced from January 2015 – May 2026(date as of publishing). These readings are self-reported and unverified, and they should be read that way throughout. They do not replace the EPA’s zone classifications, and they do not tell you what your own home’s level is. Instead, they show what homeowners who chose to test — and then chose to submit their results — reported to RadonResources.com, alongside the EPA’s 1993 Map of Radon Zones.
About This Data
This ranking is based on over 5,000 radon test readings submitted by homeowners to RadonResources.com between January 21, 2015 and May 12, 2026.
A few important disclosures come first:
- These readings are self-reported and have NOT been independently verified by RadonResources.com.
- Submitters are not required to provide test kit serial numbers, lab certifications, or chain-of-custody documentation.
- The data reflects what homeowners reported, not what has been confirmed by a third party.
- All 50 states are represented, but states with fewer than 30 submissions were excluded from this ranking. Those lower-volume states are still part of the broader user-submitted radon levels page.
- The dataset is self-selected. Homeowners who submit results are often people who had a reason to test, such as a real estate transaction, a basement bedroom, or a neighbor’s high reading.
- Readings are recorded on a scale of 1 to 20 pCi/L. Approximately 6% of submissions were recorded at the upper end of this scale, so the highest readings in the most affected states are likely understated.
- EPA zone classifications cited here come from the 1993 EPA Map of Radon Zones (EPA 402/A-16/001), which is a geological prediction tool, not measured data from individual homes.
Bottom line: this article uses one informational dataset to add context to radon levels by state, but it is not a substitute for testing your own home.
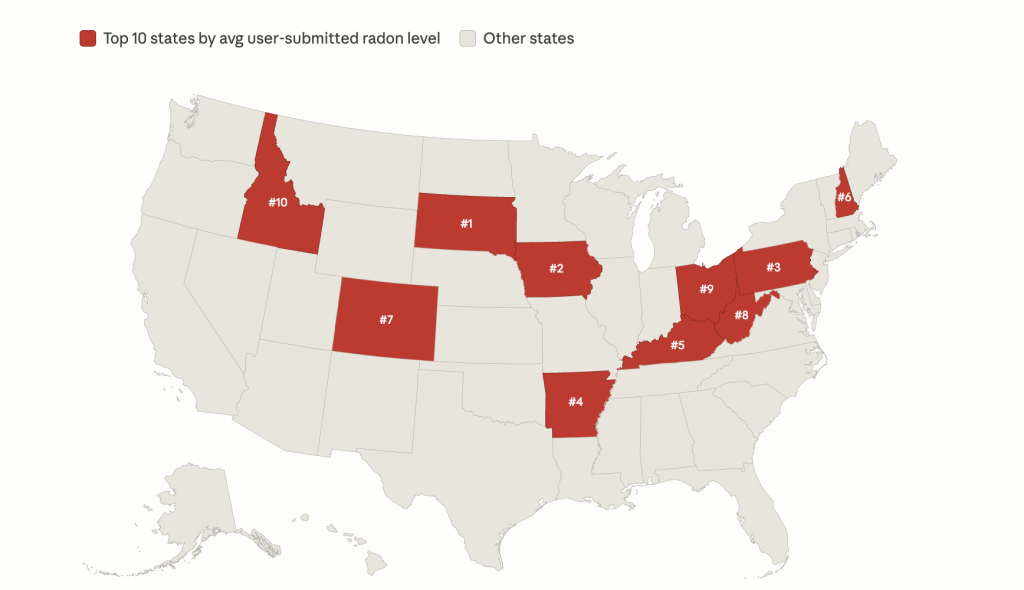
The 10 States with the Highest Average User-Submitted Readings
The ranking below is based on average user-submitted radon level, limited to states with at least 30 submissions.
| Rank | State | Avg Submitted Level (pCi/L) | Submissions | % Above 4.0 (Submitted) | EPA Zone 1 Counties |
|---|---|---|---|---|---|
| 1 | South Dakota | 10.26 | 31 | 100% | 73% of counties |
| 2 | Iowa | 10.15 | 84 | 94% | 100% of counties |
| 3 | Pennsylvania | 9.54 | 374 | 95% | 73% of counties |
| 4 | Arkansas | 9.48 | 33 | 85% | 0% of counties |
| 5 | Kentucky | 9.46 | 79 | 100% | 25% of counties |
| 6 | New Hampshire | 9.01 | 81 | 93% | 10% of counties |
| 7 | Colorado | 8.98 | 248 | 97% | 83% of counties |
| 8 | West Virginia | 8.91 | 88 | 91% | 36% of counties |
| 9 | Ohio | 8.88 | 208 | 95% | 60% of counties |
| 10 | Idaho | 8.81 | 62 | 92% | 43% of counties |
Rankings reflect the average level reported in user-submitted radon test results sent to RadonResources.com between January 2015 and May 2026. Submissions are self-reported and have not been independently verified. EPA Zone 1 percentages are drawn from the 1993 EPA Map of Radon Zones.
The EPA estimates that roughly 1 in 15 U.S. homes (about 6–7%) has radon at or above the 4.0 pCi/L action level. In the RadonResources.com submission pool, 91% of readings are at or above that level. This much higher figure reflects the nature of the dataset — people who go out of their way to test and report results are often those who already suspect a problem (real estate transaction, basement bedroom, neighbor’s reading, etc.). The submission pool is not representative of all U.S. homes, and the percentages should be read in that context.
State-by-State Breakdown
#1 South Dakota
In South Dakota, 31 submissions averaged 10.26 pCi/L. Every South Dakota submission was at or above the EPA action level, and 45% of submissions were reported at 10 pCi/L or higher. The highest submission came from Dell Rapids (ZIP 57022).
For EPA context, 73% of South Dakota counties are Zone 1. That means the state appears prominently in both types of reference points: geological prediction and homeowner-reported readings. Readings sent to RadonResources.com are self-reported and unverified, but they tell a broadly similar story here. In parts of the state, glacial till and shale deposits are often cited as part of the background geology.
#2 Iowa
In Iowa, 84 submissions averaged 10.15 pCi/L. 94% of Iowa submissions reported levels above the action level, and 44% reported 10 pCi/L or higher. The highest submission came from Glenwood (ZIP 51534).
Iowa is especially notable because it is the only U.S. state where 100% of counties are classified Zone 1 by the EPA. That makes it one of the clearest examples of homeowner submissions and EPA zone classifications pointing in the same direction. Iowa’s glacial deposits and loess soils are widely cited as part of the geological basis for its high radon potential. For homeowners researching radon risk by state, Iowa is one of the strongest cases for testing — both data sources point the same way.
#3 Pennsylvania
Pennsylvania’s 374 submissions averaged 9.54 pCi/L, the largest submission pool of any state in the dataset. 95% of Pennsylvania submissions reported levels above the action level. Submissions from Williamsport averaged 16.0 pCi/L, and Schellsburg (ZIP 15559) recorded a submission of 20+ pCi/L.
The EPA classification adds more context: 73% of Pennsylvania counties are Zone 1. In other words, a state long associated with elevated radon potential also shows consistently high homeowner-reported readings in this self-reported, unverified dataset. The Reading Prong, a uranium-rich geological formation, runs through eastern Pennsylvania and is frequently mentioned in radon discussions. Pennsylvania is one of the states most worth a closer look if you’re researching radon by state.
#4 Arkansas
In Arkansas, 33 submissions averaged 9.48 pCi/L. 39% reported 10 pCi/L or higher. Submissions concentrated in the Ozark region: Bella Vista averaged 13.7 pCi/L and Hot Springs Village averaged 11.6 pCi/L. The highest submission came from Rogers (ZIP 72756).
Arkansas has zero counties classified as EPA Zone 1. Arkansas’s EPA zone classification suggests broadly low predicted radon potential statewide. The submissions we received tell a more localized story — concentrated in the Ozark region. This is a useful reminder that EPA zone classifications describe predicted county averages, not individual homes, and that homeowners in any zone should consider testing.
That framing matters. The EPA map and the RadonResources.com dataset are measuring different things. The Arkansas submissions are self-reported and unverified, and the sample is small. Still, they provide useful local context that supports the same practical message: test your home.
#5 Kentucky
In Kentucky, 79 submissions averaged 9.46 pCi/L. 100% of Kentucky submissions were at or above the EPA action level, and 37% reported 10 pCi/L or higher. Submissions from Elizabethtown averaged 18.3 pCi/L, while Bowling Green averaged 15.8. Versailles (ZIP 40383) recorded a submission of 20+ pCi/L.
For EPA comparison, 25% of Kentucky counties are Zone 1, with the remaining counties predominantly Zone 2. That means the state’s geological classification is mixed, even though the homeowners who reported readings to RadonResources.com submitted notably high numbers. As always, those submissions are self-reported and unverified. Kentucky’s limestone karst geology and higher uranium content in some central Kentucky soils are often cited as relevant context.
#6 New Hampshire
In New Hampshire, 81 submissions averaged 9.01 pCi/L. 93% of New Hampshire submissions were above the action level, and 35% reported 10 pCi/L or higher. Submissions from Tamworth averaged 12.7 pCi/L.
EPA context is different here: only 10% of New Hampshire counties are Zone 1, while the rest are Zone 2. That does not conflict with the submissions so much as highlight the difference between county-level geological prediction and individual home reports from a self-selected sample. New Hampshire’s granite bedrock is well known in radon discussions, and the takeaway remains the same: test your home rather than relying on statewide generalizations.
#7 Colorado
Colorado’s 248 submissions averaged 8.98 pCi/L, making it one of the largest submission pools in the dataset. 97% of Colorado submissions reported levels above the action level. Submissions from Salida averaged 15.5 pCi/L, while Black Hawk averaged 15.3. Erie (ZIP 80516) recorded a submission of 20+ pCi/L.
The EPA classifies 83% of Colorado counties as Zone 1, so Colorado is another state where the two information sources tell a similar story. Readings sent to RadonResources.com are still self-reported and unverified, but the concentration of elevated submissions is consistent with the state’s widely discussed granite and uraniferous soils across the Front Range and mountain communities.
#8 West Virginia
In West Virginia, 88 submissions averaged 8.91 pCi/L. 91% of West Virginia submissions were above the action level, and 38% reported 10 pCi/L or higher. Submissions from Martinsburg averaged 16.0 pCi/L, and Wheeling (ZIP 26003) recorded a submission of 20+ pCi/L.
EPA classification shows that 36% of West Virginia counties are Zone 1. That makes West Virginia a useful example of how elevated homeowner-reported readings can appear even where the Zone 1 share is not dominant statewide. The state’s Appalachian shale and coal-bearing geology are often part of the broader radon context, but for any individual property, testing remains the only way to know.
#9 Ohio
Ohio’s 208 submissions averaged 8.88 pCi/L. 95% of Ohio submissions were above the action level, and 30% reported 10 pCi/L or higher. Submissions from Newark averaged 15.0 pCi/L, and Bellaire (ZIP 43906) recorded a submission of 20+ pCi/L.
The EPA classifies 60% of Ohio counties as Zone 1, placing Ohio among the states where geological prediction and homeowner reports broadly align. Because the RadonResources.com data is self-reported and unverified, it should not be read as a statewide measurement. But as a directional signal, it fits with the EPA’s long-standing guidance that Ohio homeowners should take testing seriously.
#10 Idaho
In Idaho, 62 submissions averaged 8.81 pCi/L. 92% of Idaho submissions were above the action level, and 40% reported 10 pCi/L or higher. Submissions from Rathdrum averaged 16.3 pCi/L, and Driggs (ZIP 83422) recorded a submission of 20+ pCi/L.
EPA context shows that 43% of Idaho counties are Zone 1. That is a substantial share, though not a statewide majority. The Panhandle’s granite formations are widely associated with elevated radon, and the homeowner-reported submissions collected by RadonResources.com point to areas where people have indeed reported higher readings. As with every state in this list, the data is self-reported and unverified and should be used as context, not as a substitute for a home test.
Where User Submissions Align with EPA Zone Classifications
In several of the top-ranked states, the EPA’s geological model and the readings homeowners voluntarily submitted to RadonResources.com tell a similar story.
Iowa is the clearest example. The EPA classifies 100% of Iowa counties as Zone 1, and submissions to RadonResources.com averaged 10.15 pCi/L. In Colorado, where 83% of counties are Zone 1, submissions averaged 8.98 pCi/L. Pennsylvania shows the same broad pattern: 73% of counties are Zone 1, and submissions averaged 9.54 pCi/L.
The pattern continues in South Dakota, where 73% of counties are Zone 1 and submissions averaged 10.26 pCi/L, and in Ohio, where 60% of counties are Zone 1 and submissions averaged 8.88 pCi/L.
These similarities do not mean one source replaces the other. The EPA map is a county-level geological prediction tool, while the RadonResources.com dataset is made up of self-reported, unverified readings from a self-selected group of homeowners. Still, in these states, both sources point in the same general direction: elevated radon potential is not just a theoretical planning concern. It is also showing up in the readings homeowners have chosen to share. For anyone researching the EPA’s Zone 1 states, this overlap reinforces the practical guidance the EPA has long given: test your home.
Where User Submissions and EPA Zone Classifications Differ
Some of the most interesting states in this dataset are the ones where user submissions and EPA zone classifications do not line up as closely at first glance.
Arkansas is the clearest example. The EPA classifies 0% of Arkansas counties as Zone 1, yet RadonResources.com submissions from the state averaged 9.48 pCi/L. Those submissions were not spread evenly statewide; they were concentrated in the Ozark region, including Bella Vista, where submissions averaged 13.7 pCi/L, and Hot Springs Village, where submissions averaged 11.6 pCi/L. That does not mean the EPA map is wrong. It means the map is doing a different job: estimating county-level average indoor radon potential from geology, not describing every individual home.
New Hampshire is another example. Only 10% of counties are Zone 1, but submissions there averaged 9.01 pCi/L. Kentucky also stands out: just 25% of counties are Zone 1, yet every Kentucky submission was at or above the action level and submissions averaged 9.46 pCi/L.
Several neutral explanations can account for differences like these. First, county-wide averages can miss localized geology that affects specific communities or subregions. Arkansas’s Ozark concentration is a good example of that possibility. Second, the RadonResources.com dataset is self-selected. People who choose to test and then submit a result are not a random cross-section of all homes, and the readings are self-reported and unverified. Third, some states in the ranking have relatively modest submission counts, which can amplify local patterns.
The practical takeaway does not change. The EPA Map of Radon Zones is a planning tool for governments and builders, not a home-by-home assessment. A Zone 2 or Zone 3 county can still contain homes with elevated radon, and the EPA recommends testing every home regardless of zone. The submission averages on RadonResources.com are useful context, but they are not substitutes for testing your own property.
What This Means for Homeowners
If you step back from the rankings, the message is straightforward: both the EPA’s zone classifications and homeowner-reported readings point toward the same action — test your home.
The EPA map offers a broad geological view. The RadonResources.com dataset shows what a self-selected group of homeowners reported after testing. Both are useful, and neither can tell you exactly what is happening inside your house. That is true whether you live in one of the states in this top 10 or in a state that did not make the list.
If you want next steps:
- Review the Radon Fact Sheet
- Compare radon test kits
- Use the radon contractor checklist
- Explore user-submitted levels in your area
- Request a free radon quote
Frequently Asked Questions
What is the EPA action level for radon?
The EPA action level is 4.0 pCi/L. If a test result is at or above that level, the EPA recommends taking action to reduce radon.
Are radon levels higher in basements?
Often, yes. Basements and lower levels are closer to the soil, which is the source of radon gas entering a home. That is one reason testing the lowest lived-in level matters.
If my state isn’t in this top 10, am I safe?
No. This top 10 only reflects self-reported, unverified submissions sent to RadonResources.com and excludes states with fewer than 30 submissions from the ranking. The EPA recommends testing every home regardless of state or zone.
How do I test my home for radon?
You can start with a home radon test kit or hire a professional. If you want to compare options, see our guide to compare radon test kits.
What should I do if my radon level is above 4.0 pCi/L?
If your result is above 4.0 pCi/L, the next step is usually to confirm the reading and speak with a qualified mitigation professional about solutions. Our radon contractor checklist can help you prepare.
If you’re ready to take the next step, you can get a free radon quote, compare radon test kits, or browse user-submitted radon levels for additional local context.