In our latest infographic, we take a look at the deadly effects of the odorless, radioactive gas known as “radon.”
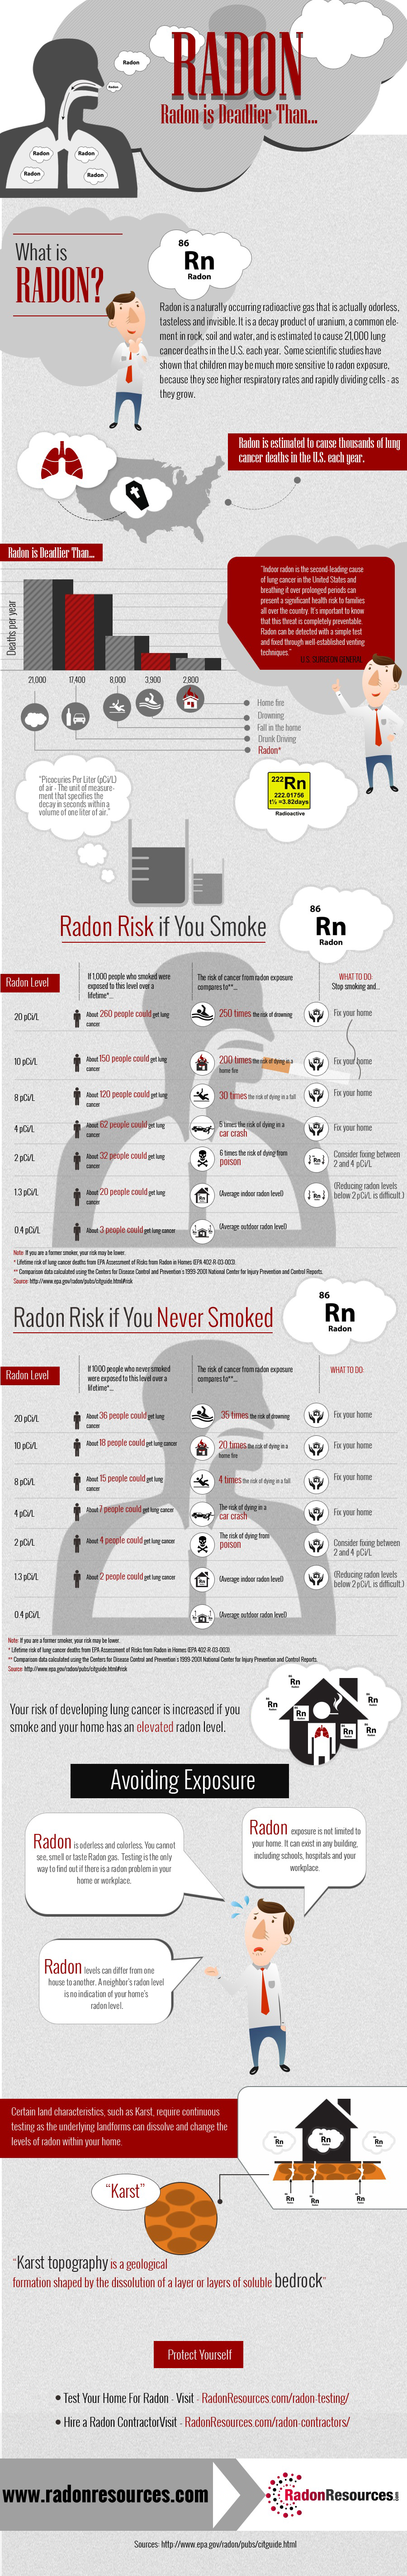
Radon is estimated to cause thousands of lung cancer deaths in the U.S. each year. Indoor radon is the second-leading cause of lung cancer in the United States, and inhalation over prolonged periods can present significant health risks to families all over the country.
It’s important to know that this threat is completely preventable. Radon can be detected with a simple test and fixed through well-established venting techniques.
Take a look at our featured infographic for more important facts about radon, and how you can avoid exposure of this silent killer. Please share to help increase radon awareness and help save lives.
Embed This Infographic on Your Site
Copy this code and paste it on your preferred web page.
Did you know?
Radon(21,000 deaths per year) is deadlier than:
- Drunk Driving (17,500 deaths per year)
- Dying from a fall (8,000 deaths per year)
- Drowning (3,900 deaths per year)
- House Fire (2,800 deaths per year)
Your risk of developing lung cancer is increased if you smoke and your home has a high level of radon.
Radon exposure is not limited to your home. It can exist in any building.
Radon levels can differ door to door. If your closest neighbor has a low reading, it does not indicate your home has safe levels.
Certain land characteristics, such as Karst, require continuous testing as the underlying landforms can dissolve and change the level of radon in your home.
Source: EPA.gov/radon
